

Transportation Operations Management Plan
DelDOT's Transportation Operations Management Plans (TOMPs) are now available in a storymap.
CLICK HERE to view and interact with the data
If you have questions or feedback on the storymaps, please reach out to DelDOT_IntOps@Delaware.gov
 The
Transportation Operations Management Plan (TOMP) is Delaware's comprehensive,
consistent statewide approach that uses integrated transportation management system
(ITMS) data to understand traffic mobility across the state. This understanding is
essential for the Delaware Department of Transportation (DelDOT) to ensure the state's
transportation system supports safe, reliable, and multimodal travel to make Delaware a
better place to live and conduct business.
The
Transportation Operations Management Plan (TOMP) is Delaware's comprehensive,
consistent statewide approach that uses integrated transportation management system
(ITMS) data to understand traffic mobility across the state. This understanding is
essential for the Delaware Department of Transportation (DelDOT) to ensure the state's
transportation system supports safe, reliable, and multimodal travel to make Delaware a
better place to live and conduct business.
The ITMS Program collects data from multiple robust sources using modern technology that enables DelDOT to monitor and manage mobility better than ever before. The real-time data collected for monitoring and dynamically managing the transportation system is also made available more widely as historical data to improve planning, design, and operations, such as is done for the TOMP. TOMP reports feed into DelDOT's project prioritization process, which uses not only operations data but also inputs such as safety data, environmental justice challenges, and multimodal mobility to select high-impact corridors for improvement. Identified projects are then submitted into the Capital Transportation Program, a document that identifies anticipated capital investments, to turn the recommendations
into reality.Current TOMP Reports
As part of the TOMP process, DelDOT collaborates with local stakeholders including the state's metropolitan planning organizations (MPOs) in Newark and Dover. DelDOT maintains a TOMP summary report for each county.
Methodology
Millions of traffic data points collected over several years have enabled unparalleled understanding of travelers' experiences with traffic in Delaware. TOMP reports are developed based in part on ITMS data collected automatically from various traffic monitoring devices and supplemented with data collected manually at select locations. This information is used to identify "hotspots" where congestion keeps travelers from reaching their destinations on time. Then, it is used to develop recommendations for each hotspot, which are presented in the TOMP report. Some solutions are already underway, some new ideas can be accomplished quickly in the short term, and other new ideas involve longer-term projects.
Using Data to Monitor Traffic Operations
How can we use Delaware's traffic data to determine where congestion is? We know traffic congestion occurs when traffic demand exceeds roadway capacity. This imbalance of demand and capacity can be found by monitoring travel time and volume data which are pulled from Wavetronix, signal system loops, and Bluetooth detectors.
Travel Time Reliability
Delay is a congestion measurement tool that is simply the additional travel time experienced by a driver, passenger, or pedestrian. For example, it typically takes you 20 minutes to get to a destination, but you experienced a 10-minute delay and got there in 30 minutes. This notion of "how long does it take you to get there compared to what I expect" is reflected in an analytical concept known as "travel time reliability" endorsed by the Federal Highway Administration. By comparing longest-measured (95th percentile) travel times to uncongested travel times over long periods, we can identify congested areas on Delaware's roadways. Similarly, we can compare average travel times to uncongested travel times for those same periods to get a "travel time index" giving an idea of typical conditions.
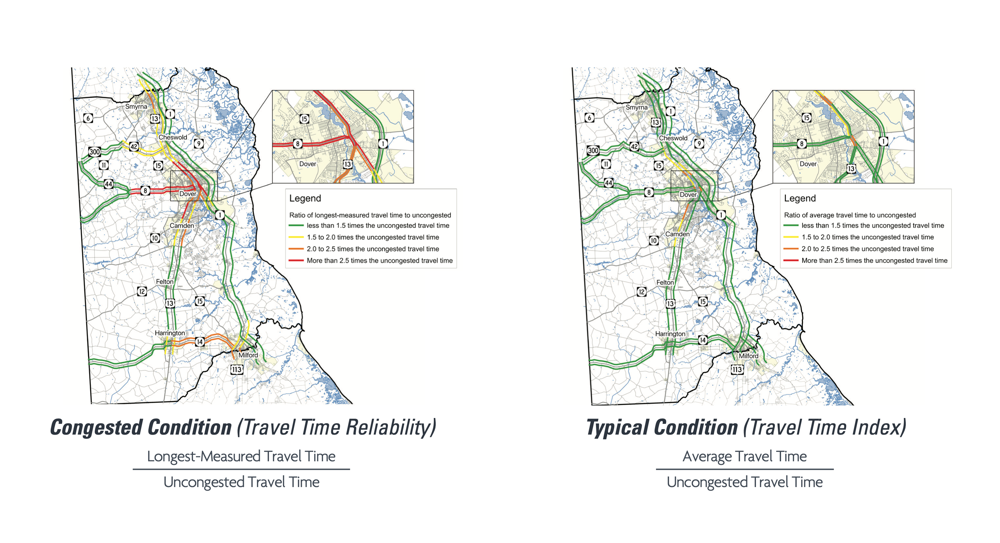
*To view map details see Kent Count TOMP report
Traffic Demand
In addition to monitoring delay, we monitor traffic volumes to measure traffic demand and to study the imbalance between demand and capacity. By pairing travel times with volumes, we can see how many vehicles are impacted by delays.
Particularly in urban areas, looking at an intersection's demand and capacity along with travel time on its adjacent links helps us understand traffic operations. Intersection critical movement summation (CMS) is a quick, hands-on look at an intersection's demand and capacity, that is, its ability to process the traffic volume given its current lane configuration and signal phasing.
Demand vs Capacity
Estimating traffic demand can be difficult. That's why we consider multiple data types. Consider traffic volume, for example. If we count vehicles passing a particular point on SR 896 during rush hour when traffic is stop and go, the volume indicates how many cars actually make it through, not how many are backed up behind that point. Still, traffic counts are a good starting point to estimate demand.
Then we add travel time measurements, which give a fuller picture of the congestion and how to fix it. If your travel time statistics indicate that what should have been a 20-minute trip took 40 minutes, that shows the roadway is congested - whether or not your vehicle gets counted.
Putting data sources together is the only way to get an accurate picture. An intersection on SR 896 that has a B (good) CMS rating, which indicates sufficient capacity, may be surrounded by roadways whose travel times indicate significant delay. The single data source tells one story, and the combination of sources tells the true story.
Identifying Congestion Hotspots
Layering data gives a complete picture of traffic operations. The TOMPs combine travel time reliability (congested conditions) with travel time index (typical conditions) to calculate congestion frequency on Delaware's roadways.
Congestion Frequency
If there's a crash on SR 896 at 5 pm on a weekday, we could see longest-measured travel times of, say, 60 minutes for a trip that should take 20 minutes when traffic is flowing freely. That's a travel time reliability of 3. But that crash happened only once, so it's not by itself an indication of congestion frequency. Therefore, we add the travel time index, which is based on average travel times. If that 20-minute trip takes 40 minutes most weekday mornings, it has a travel time index of 2 (40 minutes divided by 20 minutes). Since the travel time reliability and travel time index are both greater than 1.5, we consider this segment "frequently congested".

Level of Service
TOMP's congestion hotspot analyses also consider intersection level of service (LOS) based on CMS analysis. Level of service A, B, or C means the location should be able to handle the traffic. Level of service D, E, or F means vehicles might wait for more than one traffic signal cycle, even with improved signal timings. Traffic signal cycles typically range from 2 to 3 minutes.
Recommendations
Intersection LOS and analysis of congestion frequency are layered together to reveal hotspots where congestion has significant impact on mobility. The TOMP reports offer recommendations to address recurring and non-recurring congestion in each county, specifically at hotspots. They also outline recently completed, ongoing, or planned projects to alleviate congestion on key corridors.